 |
| |
| |
|
|
||||||||||||||||||||||||||||||||||||||||||||||||||||||||||||||||||||||||||||||||||||||||||||||||||||||||||||||||||||||||||||||||||||||||||||||||||||||||||||||
How the Dioxins reduce in the garbage furnace by combusted with coalA. Main ReasonB. Experiment C. Result Coal effect on fore-produce PCP Results of the 3-stage fluidized bed The Results of the 1MW Fluidized Bed A. Main ReasonHCl is common in the flue gas coming from the garbage furnace. When there is Cu existed, the Deacon Reaction will take place and the HCl will change into Cl2. The existent of Cl2 will promote Dioxins production. The reaction formula as follows: 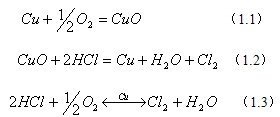 When the garbage furnace operating with the coal, there will be SO2 existed. SO2 will react with Cl2 and H2O and change into HCl and SO3. This reaction will reduce the Cl2, so do the Dioxins. The reaction formula as follows: 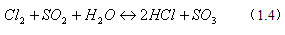 In another way, the catalyst Cu in formula 1.3 will be poisoned by the SO2, and it will change into CuSO4 with less active. The reaction formulas as follows: 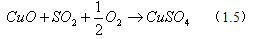 Because of the catalyst posioned and the less Cl2 contain in the flue gas, so the Dioxins is less than the normal garbage furnace which don’t combusted with coal. B. ExperimentAll the experiments are taking place in small pipe furnace, 3-stage fluidized bed experimental platform, and 1MW fluidized bed furnace. The fuel analysis is in Table 1.1. Table 1.1 Fuel Analysis
C. Result1. Coal effect on fore-produce PCPThe experiment results are in the table 1.2 and graph 1.1. The higher ratio between PCP and coal is, the more Dioxins produced. Table 1.2 PCP Reults (ng/g PCP)
 Graph 1.1 The coal's effect on the PCP
2. Results of the 3-stage fluidized bedThe combust temperature of the 3-stage fluidized bed is 800c. The fluidize quantity is
1.4m3/h. The weight ratio between coal and PVC is 1:2. The sulfur concentration in
the coal is 3.88%. The ratio between waster paper and coal is 8:2, and the ratio
between garbage and coal is also 8:2. Graph 1.2 The Dioxins Creating in PVC Combustion When the coal added in the waste paper combustion, the Dioxins also were limited. The results are in the graph 1.3. 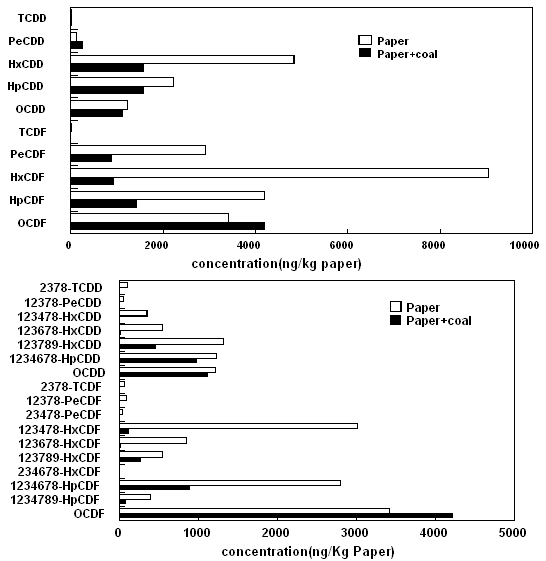 Graph 1.3 The Dioxins Produced in the Waste Paper Combustion The results of the coal and garbage mixture combustion is in the graph 1.4. Graph 1.4 The Dioxins Produced in the Garbage Combustion
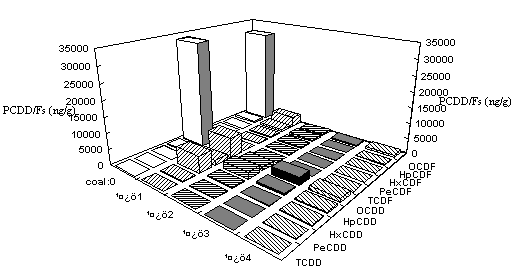
3. The Results of the 1MW Fluidized BedTable 1.3 1MW Fluidized Bed Exhaust
Graph 1.5 Temperature and the Dioxins
The graph 1.6 and graph 1.7 is about the CO and coal effect on the Dioxins producing. The less coal in the mixture fuel, the more Dioxins produced. 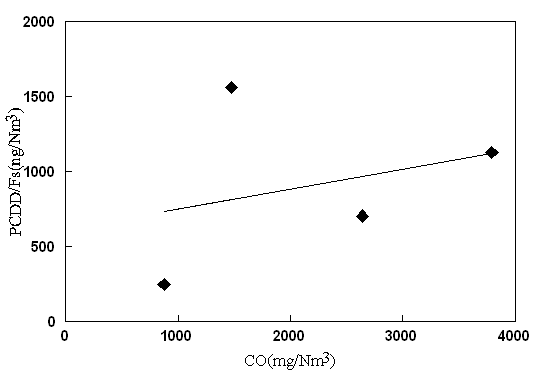 Graph 1.6 CO Effect 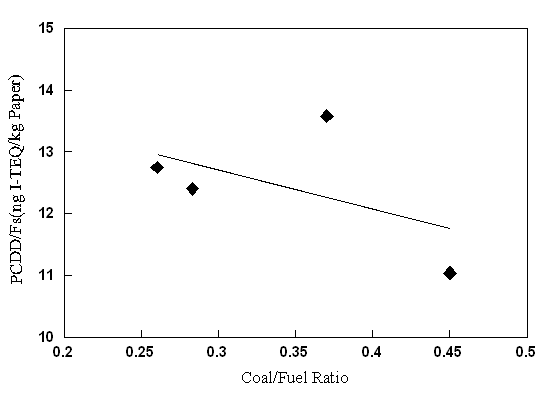 Graph 1.7 Coal Mixed with Garbage Effect
|
|